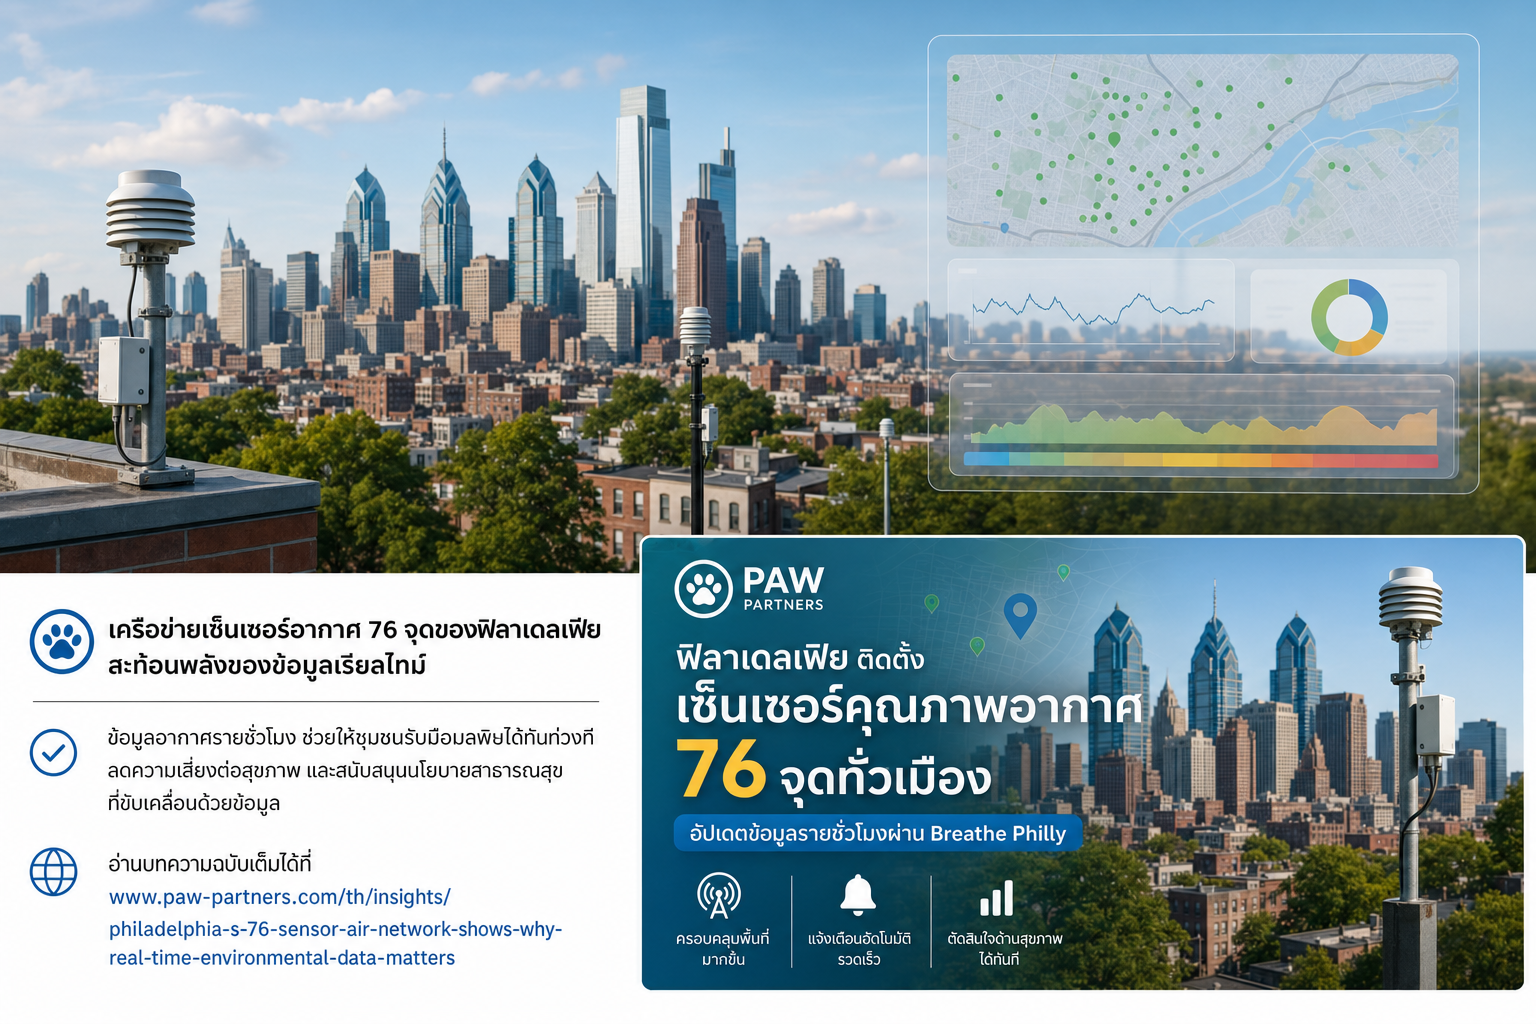
On February 18, 2026, WHYY reported that Philadelphia public health officials had rolled out a new network of 76 air quality sensors across the city. The system is designed to give neighborhoods a much finer view of local conditions and to post hourly air quality index updates on a new website called Breathe Philly.
The timing mattered because the city had just seen a real-world test of the network’s value. During a trash fire at the WM transfer station in Grays Ferry, an older monitor more than a mile away did not detect the smoke, while a new sensor at Stinger Square Park recorded a slight increase in unhealthy pollution and moved the local reading from “good” to “moderate.”
The system is being run by Philadelphia public health officials and uses subscription-based monitors from Clarity. The city said the new network fills gaps left by 11 federally mandated sensors, and it is more responsive than an earlier set of 50 street-level monitors whose data was not shared in real time because samples had to be collected manually and analyzed later.
For operations teams, the story is less about one city and more about a familiar systems problem: coverage, latency, and decision quality. If the data arrives late or from the wrong place, public guidance can lag behind the event. In environmental monitoring, just as in industrial automation or connected products, the value comes from turning raw signals into timely action.
Why denser sensing matters
The city’s new deployment is meant to improve neighborhood-level visibility, not just provide a broad regional reading. Officials said at least one monitor is within 1.5 miles of every address in Philadelphia, which makes the network much more useful for localized decisions than a small number of stationary monitors.
That matters because pollution exposure is not evenly distributed. Areas with traffic, idling vehicles, and industrial activity can face heavier burdens than nearby blocks, even when a citywide average looks acceptable. A denser network helps reveal those differences and makes inequities easier to measure, explain, and address.
What the data can and cannot do
The sensors measure fine particulate matter and nitrogen dioxide, both of which are common pollutants tied to vehicle exhaust, power generation, and industrial activity. Hourly updates are enough to support practical choices such as closing windows, reducing outdoor exertion, or delaying a trip outside when conditions worsen.
At the same time, the network is not a complete picture of air quality. The article notes that it does not measure volatile organic chemicals or carcinogens, and that hourly rollups may hide shorter spikes. That limitation is a reminder that every monitoring program needs clear expectations about what the system can detect, how fast it reports, and where manual or mobile follow-up is still required.
- Use fixed sensors for continuous coverage.
- Use mobile monitoring for incident response and validation.
- Use dashboards and alerting to translate readings into action.
Operational lessons for connected systems
The strongest lesson for B2B engineering teams is that useful sensing depends on the full stack, not just the sensor hardware. Connectivity, uptime, calibration, backend ingestion, and alert routing all determine whether data becomes a decision tool or just another dashboard.
That is where Paw Partners’ capabilities align naturally with this kind of program. Electronic prototyping, IoT device integration, software workflows, and dashboard design can turn scattered measurements into a dependable operational system with clear thresholds, automated notifications, and audit-friendly reporting.
In practice, that means designing for maintenance as much as for measurement. Sensors need health checks, data pipelines need failover, and operators need clear escalation rules when readings cross a threshold. Reliable environmental monitoring is a service model as much as a hardware project.
Source: WHYY